 FLIMKit
Plugins / FLIMKit / QuPath Bridge · edit on GitHub
QuPath Bridge
ROIs can already be exported as GeoJSON and imported back, which is enough if you are happy moving files by hand. The QuPath extension removes that step: it talks to the FLIMKit bridge, so QuPath reads and writes FLIMKit's images and ROIs directly, and can run FLIMKit's fits on the image you have open.
It runs inside a live QuPath session rather than as a script, so it works with the image you have open and the annotations you have drawn.
Installing
Two halves, one on each side.
pip install flimkit-bridgeinto the environment FLIMKit runs in (FLIMKit Bridge).- In QuPath, open
Extensions > Manage extensions, addhttps://github.com/FLIMKit/flimkit-qupath-bridgeas a catalog, and install FLIMKit bridge from it. QuPath then offers each new release, so you don't have to fetch jars by hand.
If you'd rather install by hand, download qupath-extension-flimkit-bridge-*.jar from the releases page and put it in QuPath's extensions directory, normally ~/QuPath/v0.7/extensions. You'll have to repeat that for every update.
pip install flimkit-qupath-bridge used to be step 1 and still works, but that package is being sunset. It is a shim that re-exports flimkit-bridge, warns on import, and is removed in 0.7.0.
QuPath 0.7.0 or newer is required, and FLIMKit 0.13.0 or newer.
Using it
Everything is under Extensions > FLIMKit bridge:
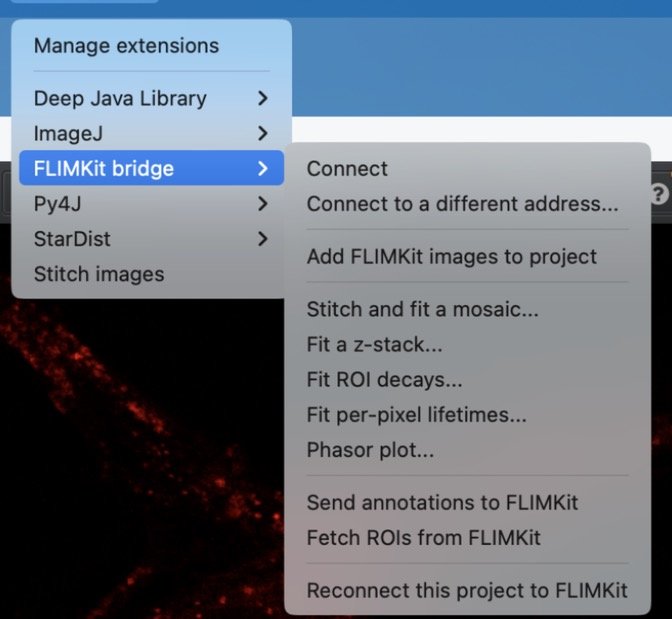
| Command | What it does |
|---|---|
| Connect | Pair with the running FLIMKit, or a headless flimkit-bridge, by reading ~/.flimkit/bridge.json. A notice confirms the address |
| Connect to a different address... | For a bridge whose pairing file QuPath cannot read, such as one in a container or at the far end of an SSH tunnel |
| Add FLIMKit images to project | Puts FLIMKit's intensity and lifetime maps into the open project in real units, intensity as 16-bit photon counts when they fit and lifetime as 32-bit float in ns, so they sit beside a brightfield or mIF image |
| Stitch and fit a mosaic... | Runs FLIMKit's tile pipeline on a .lif, .xlif or .xlef and adds the maps to the project |
| Fit a z-stack... | Fits a folder of region_zN.ptu slices as one FOV and opens the result as an OME-Zarr z-stack |
| Fit ROI decays... | Fits the decay summed over each annotation |
| Fit per-pixel lifetimes... | Per-pixel fit of the open FLIM image, added to the project as one image with a channel per map |
| Phasor plot... | Opens the phasor window for the image in view |
| Send annotations to FLIMKit | Posts the annotations on the current image to FLIMKit's Regions table |
| Fetch ROIs from FLIMKit | Pulls FLIMKit's regions in as annotations |
| Reconnect this project to FLIMKit | After FLIMKit restarts, reopens on the FLIMKit side every file this project recorded |
QuPath also opens FLIM files itself. Opening or dropping a .ptu makes QuPath ask the bridge whether FLIMKit recognises it, so the file opens through FLIMKit without connecting first. Pass -Dflimkit.bridge.imageserver=false to QuPath to turn that off.
From FLIMKit, the Send to a viewer button in the ROI panel reports whether QuPath has connected and what is being served.
The phasor window
Phasor plot... draws the same density plot the desktop app does, for whichever time-domain file QuPath has open. The header gives the laser frequency and the binning the phasor was computed at. This is Ado_1.ptu with the machine IRF calibration applied:
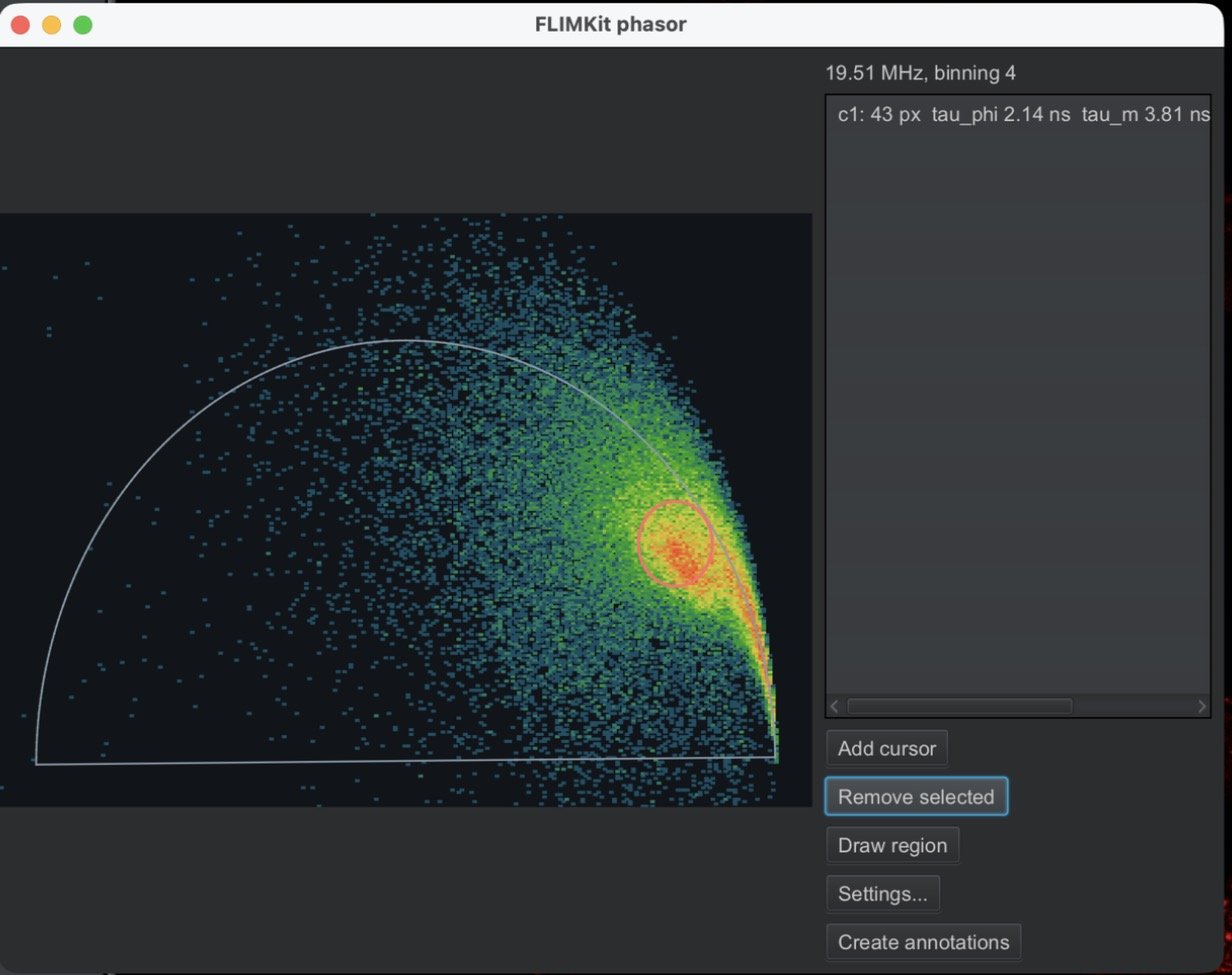
Click on the plot to place an elliptical cursor and drag to move one. Each cursor reports its pixel count, phase and modulation lifetimes (tau_phi, tau_m), and six is the limit because that is how many colours the palette has. Remove selected deletes the cursor highlighted in the list.
Draw region switches the plot to tracing. Drag to draw an outline and it becomes a cursor when you let go, so a population that is not an ellipse can still be selected. The outline goes to FLIMKit as a polygon in G and S, points closer than three pixels apart are dropped, and fewer than three points is not a region. Drawn regions cannot be dragged afterwards; remove and redraw instead.
Create annotations turns the cursors into QuPath annotations, one per cursor, classified as Phasor and carrying the same measurements the list shows. The phasor is computed on binned pixels, so the outlines are traced at that resolution and scaled back to full-resolution image coordinates.
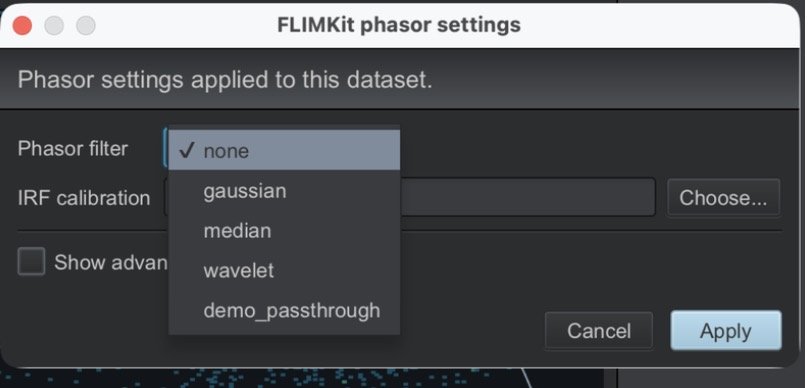
Settings... picks the filter and the calibration:
| Setting | Values | What it does |
|---|---|---|
| Phasor filter | none, gaussian, median, wavelet, plus anything a plugin registers |
Spatial smoothing of G and S. The screenshot shows demo_passthrough, registered by examples/plugins/demo_plugin.py |
| IRF calibration | none, or a machine IRF .npy picked with Choose... |
Rotates and scales the phasor onto the calibrated frame |
| Gaussian sigma (px) | 0.1 to 10, under Show advanced settings | Width of the gaussian kernel |
| Median window (px) | 3 to 15, under Show advanced settings | Size of the median window |
Calibration runs before filtering, the same order the desktop app and phasor_cli.py use, so the same file gives the same coordinates whichever front end you drive it from.
Nothing is calibrated by default. Without calibration the cloud sits off the semicircle, which is still useful for comparing populations within one image, but the absolute lifetimes it reports are not. A machine IRF describes one microscope, so you have to build your own under Tools > Machine IRF Builder (Machine IRF Setup).
Changing a setting recomputes the phasor. The bridge caches per dataset and per setting, so switching back to a combination you have already looked at is immediate.
Stitching and z-stacks from QuPath
Stitch and fit a mosaic... takes the .lif, .xlif or .xlef that holds the tile positions and runs the whole pipeline on the FLIMKit side. The tiles do not have to sit beside it: the bridge looks in the folder you name, beside the container, and in the folders next to it, which is where Leica puts them.
The Pipeline setting picks how. tile_fit, the default, fits each tile after a global summed fit and assembles the maps. stitch_fit stitches the raw photons into one canvas and fits that, which means writing the whole photon cube to disk first: 124 tiles at 512 square make a 5581 square canvas, which is 57 GB at 459 bins. Pick stitch_fit when you want the stitched photon cube itself, and tile_fit otherwise.
Fit a z-stack... asks for a folder of slices, says how many stacks and slices it found before offering any settings, and then fits each stack as one FOV: the decay is pooled over every slice, the lifetimes are fitted once and locked, and each slice gets a per-pixel fit with only the amplitudes free. The result opens in QuPath as a real z-stack, one OME-Zarr store per stack with a channel per map (intensity, tau_mean_int, tau_mean_amp, an alpha_N per component). ome-tiff is the other output choice, for a viewer that will not read the store.
Co-registration
FLIMKit expects ROIs in FLIM image-pixel coordinates, so anything drawn on another image has to be transformed into that space first. That happens on the QuPath side.
This needs QuPath's alignment extension, which QuPath does not ship and which has to be installed separately. The bridge deliberately contains no alignment code of its own.
Align on the intensity image rather than the lifetime map. The alignment extension cannot render 32-bit float and throws rather than declining, and the lifetime map has to be float to carry nanoseconds. Photon counts are whole numbers, so intensity crosses as 16-bit whenever that is lossless, which the extension opens without complaint. The transform is valid for the lifetime map as well, since every image of that field shares one pixel grid.
- Open the brightfield or mIF image and add the FLIMKit images to the same project.
- Align the brightfield against the intensity image and transfer the annotations onto it.
- Send the annotations on the aligned image to FLIMKit.
Without the alignment extension you can still exchange images and ROIs, but only between images that already share a coordinate system.